
Nassau & Suffolk County Market Intelligence
What October’s Market Means for Long Island Sellers
Single-Family Home Market Update Through October 2026
Long Island single-family home prices remained higher over the 12 months through October 2026. The rolling median sales price rose 4.2% in Nassau County and 5.1% in Suffolk County compared with the preceding 12 months.
The October-only figures show more homes for sale than a year earlier, while closings declined in both counties. Buyers have more choices, and price, condition and value remain important.
The October Takeaway
Rolling median prices rose in both counties, while October inventory increased and closings declined from a year earlier.
Long Island Single-Family Market: The Big Picture
Up 4.2%
Up 5.1%
Up in both counties
The rolling 12-month median sale price was $860,000 in Nassau and $725,000 in Suffolk, compared with $825,000 and $690,000 in the previous rolling periods. Closed sales were down 0.7% and 1.7%, respectively.
In October alone, the median sale price reached $871,000 in Nassau and $733,500 in Suffolk. The month-end inventory count rose 2.4% in Nassau and 5.3% in Suffolk compared with October 2025. The rolling 12-month inventory figures below describe a longer period and should not be confused with the October snapshot.
Compare these figures with the June 2026 market update and the July 2026 market update.
Nassau County Single-Family Home Market
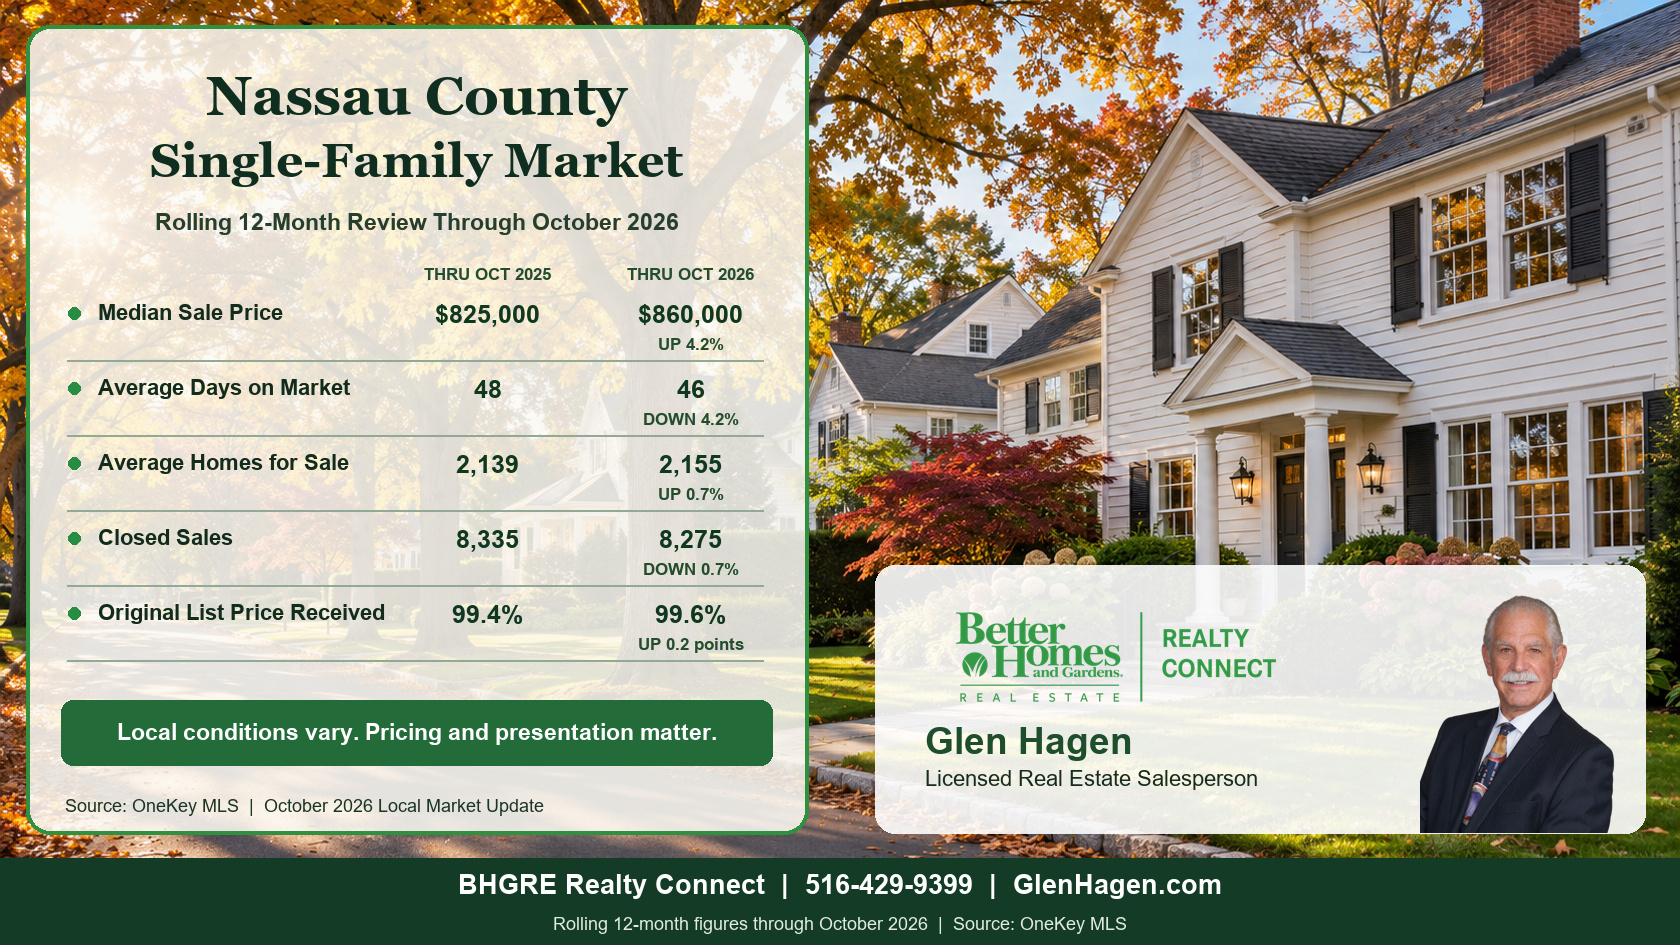
Nassau’s rolling median sales price rose from $825,000 to $860,000, a gain of 4.2%. Closed sales eased from 8,335 to 8,275, down 0.7%. Average days on market until sale fell from 48 to 46, while the rolling inventory measure increased from 2,139 to 2,155 homes, up 0.7%.
Sellers received an average of 99.6% of their original list price, compared with 99.4% in the prior rolling period. Individual outcomes depend on the home and its market.
What stands out in Nassau
October closed sales slipped from 798 to 789, down 1.1% from a year earlier. Homes for sale at month-end rose from 2,234 to 2,288, while the October median price increased 4.9% to $871,000. Conditions can vary among communities such as Massapequa, Seaford and Wantagh.
Suffolk County Single-Family Home Market
Compare these figures with the June 2026 market update and the July 2026 market update.
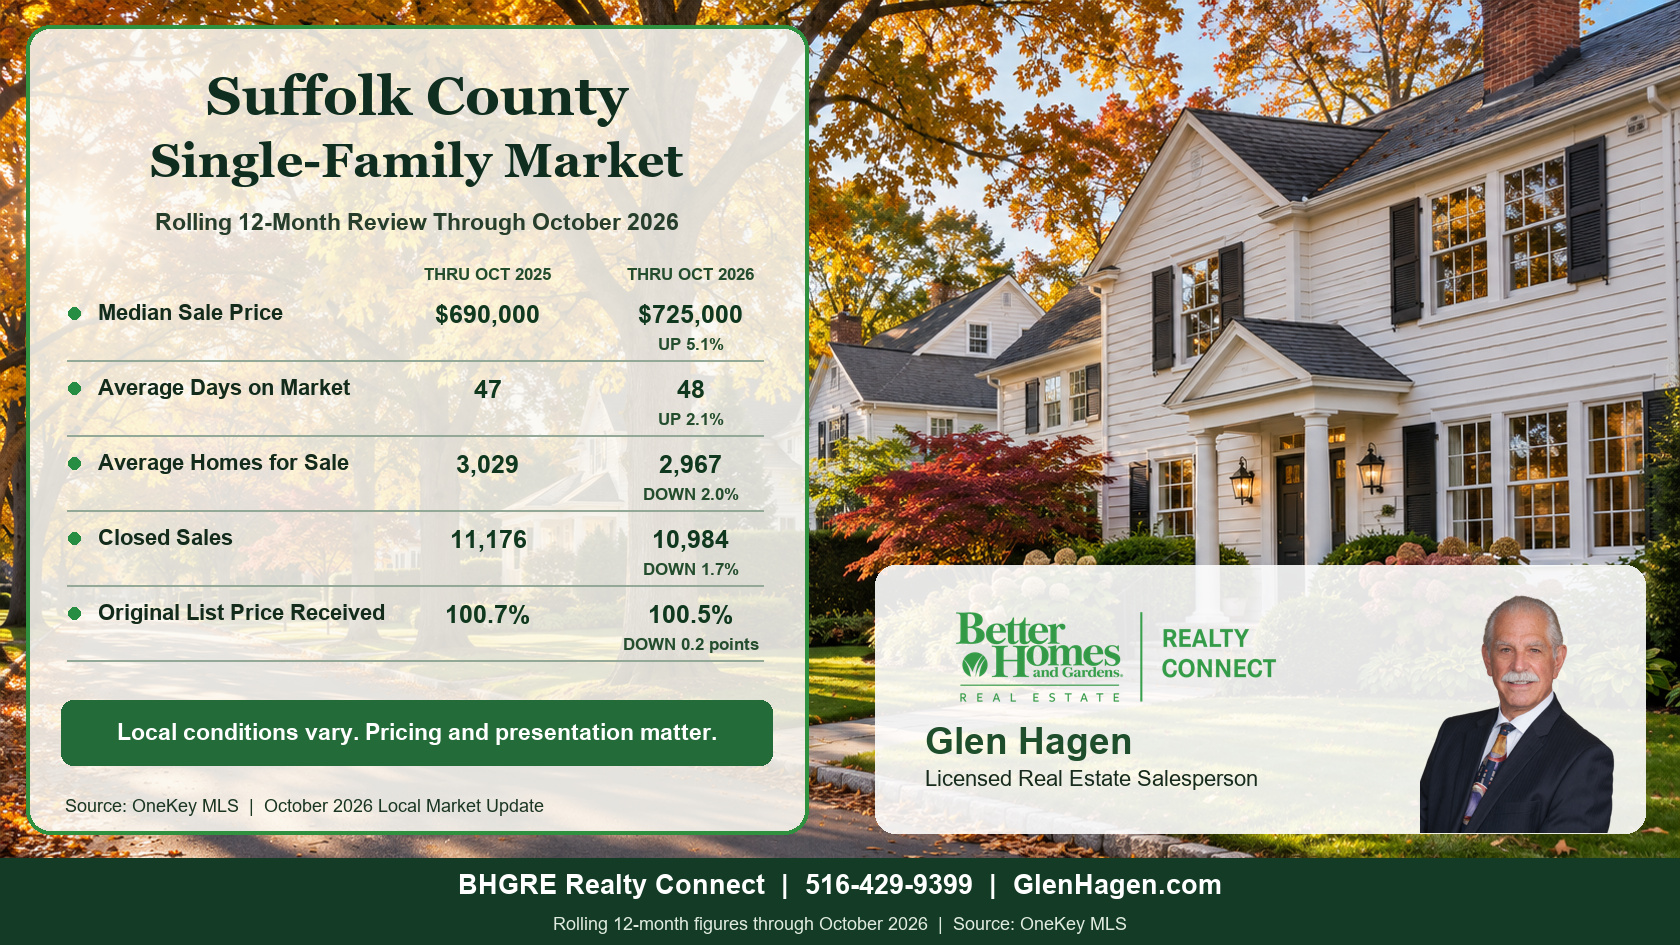
Suffolk’s rolling median sales price increased from $690,000 to $725,000, up 5.1%. Closed sales declined from 11,176 to 10,984, down 1.7%. Average days on market until sale rose from 47 to 48, and the rolling inventory measure fell from 3,029 to 2,967, down 2.0%.
Sellers received an average of 100.5% of original list price, compared with 100.7% in the prior rolling period. The result reflects the county as a whole; it does not mean every home sold above asking.
What stands out in Suffolk
October closed sales declined 8.4%, from 1,130 to 1,035. Homes for sale at month-end increased 5.3%, from 3,146 to 3,314. That monthly increase and the decline in the rolling inventory measure describe different periods. Local conditions in Bay Shore, Huntington and Smithtown may differ from the countywide picture.
What This Means If You’re Selling
- Rolling median prices rose in both counties.
- The October inventory snapshot showed more choices for buyers than a year earlier.
- October closings were lower in both counties, particularly in Suffolk.
- Accurate pricing, preparation and a review of competing listings remain important.
- Your town, neighborhood, price range and property condition matter more than countywide figures alone.
Frequently Asked Questions
Are Long Island single-family home prices still rising?
The rolling 12-month median rose 4.2% in Nassau and 5.1% in Suffolk through October 2026 compared with the previous rolling periods. A median describes the middle sale and does not measure the change in value of every home.
Are buyers seeing more choices?
The number of single-family homes for sale at the end of October was higher than a year earlier in both counties. The selection available to a particular buyer can vary by location and price range.
Are sellers receiving their asking price?
Across the rolling 12 months, the average sale price was 99.6% of original list price in Nassau and 100.5% in Suffolk. Individual results vary, and these figures do not account for seller concessions or down-payment assistance.
How can I find out what is happening in my town?
A review of recent sales, pending listings and current competition in your area will provide a more useful picture for your property than countywide figures alone. Check out some individual market updates below.
Thinking About Selling?
Let’s Look at Your Local Market
If you are thinking about selling, I can prepare
a local, no-obligation review of recent sales, current competition and your home’s likely value range.
Don’t see your market stats?
Request your update here!
Glen Hagen
Licensed Real Estate Salesperson
BHGRE | Realty Connect
GlenHagen.com | 516-429-9399
Explore October 2026 Market Updates
Source: OneKey MLS, Nassau and Suffolk County Local Market Updates through October 2026. Rolling 12-month figures cover November 2025 through October 2026, compared with November 2024 through October 2025. Median sale price and original-list-price figures do not account for sale concessions or down-payment assistance. Percentage changes are calculated using rounded figures.